What is Gravestone Doji

The gravestone doji is a candlestick pattern observed in technical analysis, characterized by its long upper shadow and absence of a lower shadow, resembling a tombstone.
This pattern typically suggests a potential bearish reversal when it appears at the end of an uptrend,
Identifying Gravestone Doji
A few characteristics make Gravestone Doji easily detectable. They are :
1- The Opening price and the closing price are close to each other
2- They usually appear at the top of the bottom of the chart.
3- They have long wicks in one direction.
Types of Gravestone Doji
There are two types of Gravestone doji,
1. Bullish gravestone doji
Bullish Gravestone Doji appears when a chart is on a downtrend. it shows that sellers might be getting weak, and buyers are present at that price
An example is given below
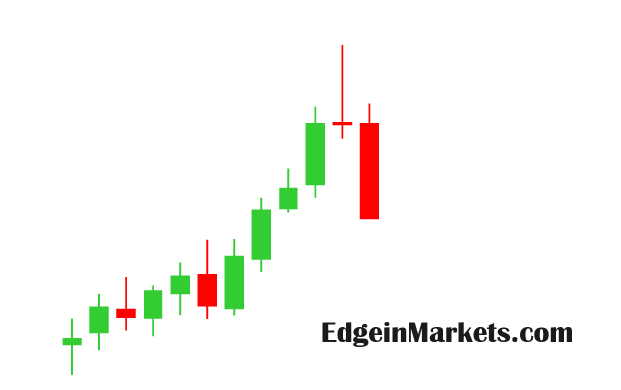
2. Bearish gravestone doji
A Bearish Gravestone Doji appears when a chart is on an uptrend. It shows buyers might be getting weaker, and sellers are stronger at that price.
How to trade Gravestone Doji
Trading the gravestone doji involves considering its appearance within the context of the market and using it as a signal for potential reversals.
Entry will be at the break of the doji candle, and the stop will be at the highs or lows of the candle.
Gravestone doji alone is not enough to form a trading judgment. It must have other confluences such as momentum, extension, news, etc.
Gravestone Doji Trade Examples
In Day Trading Strategies: Real Examples From Real Traders [2024], I gave an example of a scalp trade on an extension of the ticker COIN.

This is an example of a Bullish Gravestone Doji.
After multiple sell-off days, the context showed that the COIN was over-extended to the downside once the gravestone doji was formed. We took a long and trailed stop with prior candle lows.
This gave a decent R: R on the trade.

The context of this trade was crucial for its success. We had multiple confluences.
1-Extended Daily chart
2-Volume capitulation
3-Theme trade as BTC was rallying.
Limitations of the Gravestone Doji
While the Gravestone Doji candlestick pattern can provide valuable insights into market sentiment and potential trend reversals, traders must be aware of its limitations. Here are some key limitations to consider when trading the Gravestone Doji:
Single Candlestick Pattern: The Gravestone Doji is just a single candlestick pattern and should not be relied upon in isolation for trading decisions. Before taking any trading positions, it’s crucial to consider other technical indicators, market context, and confirmation from subsequent price action.
False Signals: Like any technical analysis tool, the Gravestone Doji is not infallible and can sometimes produce false signals. Not every instance of a Gravestone Doji will result in a trend reversal. Traders should exercise caution and wait for confirmation from other factors before acting on the signal.
Market Context: The effectiveness of the Gravestone Doji can vary depending on the prevailing market conditions. In strongly trending markets, minor retracements represented by the Gravestone Doji may not lead to significant reversals. Traders should consider the broader market context and trend strength before interpreting the pattern.
Subjectivity: Interpreting candlestick patterns, including the Gravestone Doji, involves a degree of subjectivity. Different traders may interpret the same pattern differently, leading to varying trading decisions. To minimize subjectivity, traders must develop clear rules and guidelines for interpreting candlestick patterns.
Risk Management: Trading solely based on candlestick patterns such as the Gravestone Doji without proper risk management strategies can be risky. Traders should always define their risk tolerance, set stop-loss orders, and manage position sizes to protect against potential losses.
What you learned
you learned about the Gravestone Doji, a candlestick pattern indicating potential trend reversals. It forms at the end of an uptrend, characterized by a long upper shadow and the absence of a lower shadow.
Two types exist: bullish and bearish, each signaling weakening buying or selling pressure.
Trading strategies involve entering trades at the break of the Doji candle, supported by other indicators. Real-life examples illustrated its application. However, you also learned about its limitations, including the need for confirmation from other factors, subjectivity, and proper risk management.